Statistical evaluation
You have several ways to track your progress. On the one hand, you receive direct feedback on your performance directly after an exercise. On the other hand, there is a separate page ‘Statistics’, where you can see various evaluations.
Further information:
Evaluation after training
You must end each workout using the ‘Save and quit’ button so that your data is saved:

Now you should see the following window:
Hint:
You may not yet see the course of the reaction time (graphic), as you have not practiced enough

To see exactly what response times you had for each object, click on the image with the sky and lake to open a detailed view:

You should now see such a graphic:
The dots show where you found the object and how long it took you to find it (in seconds)
Red dots indicate that you have not found the object or that it was faulty

‘Statistics’ page
To follow these instructions, you must be on the home page.
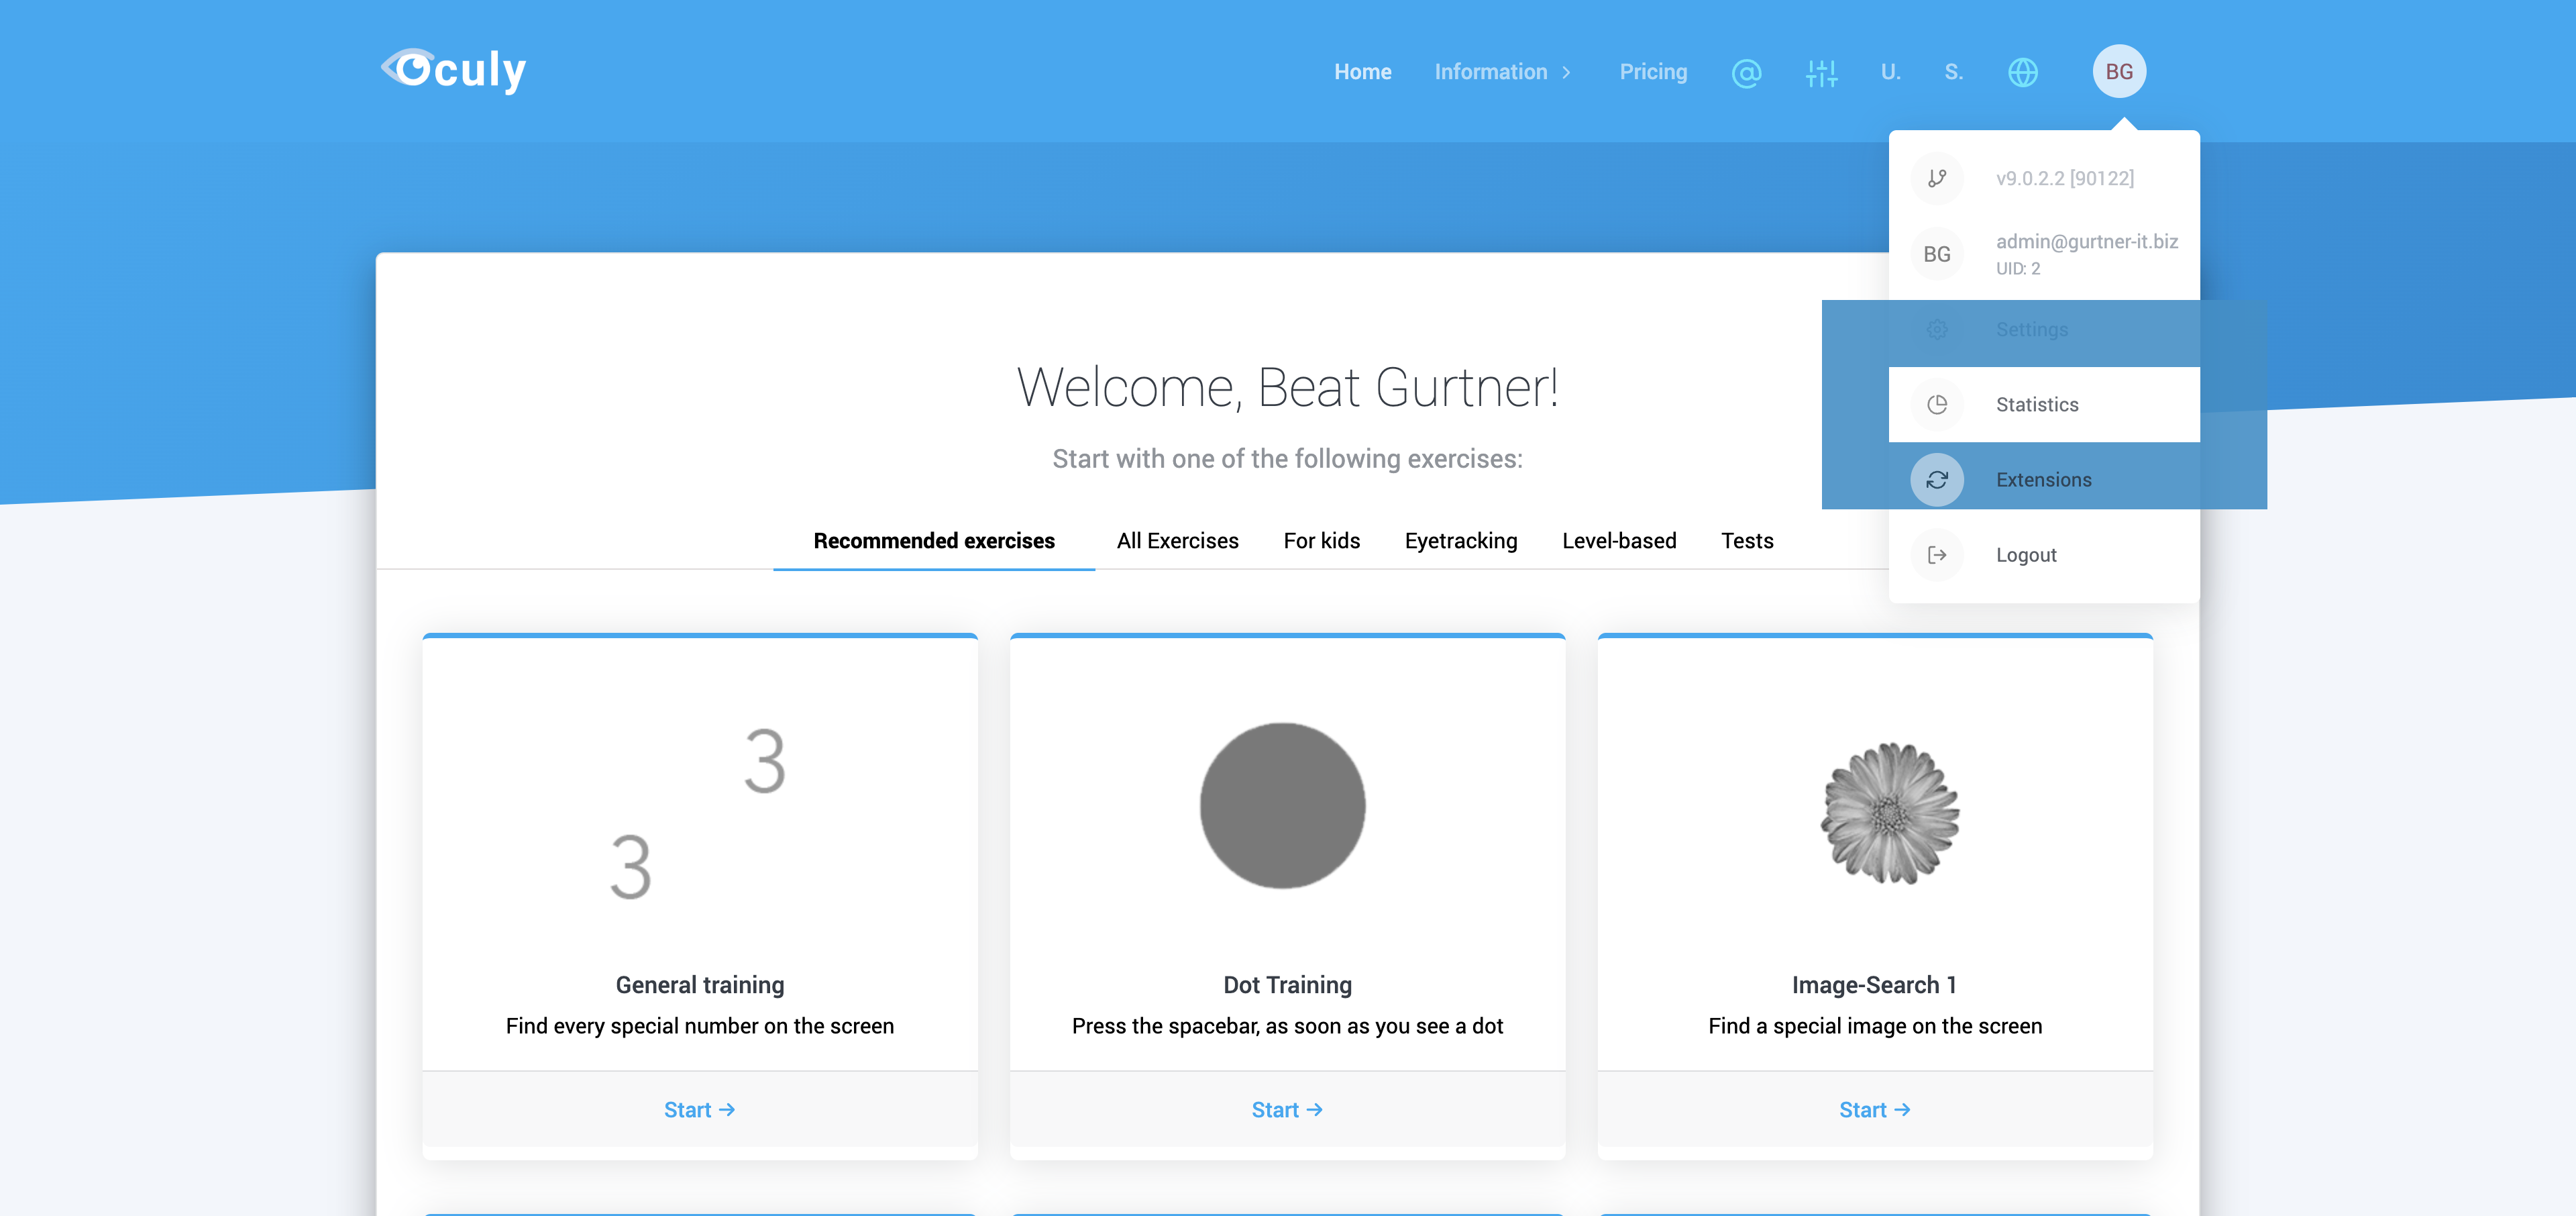
1. Click on ‘Statistics’ above
2. See your response time
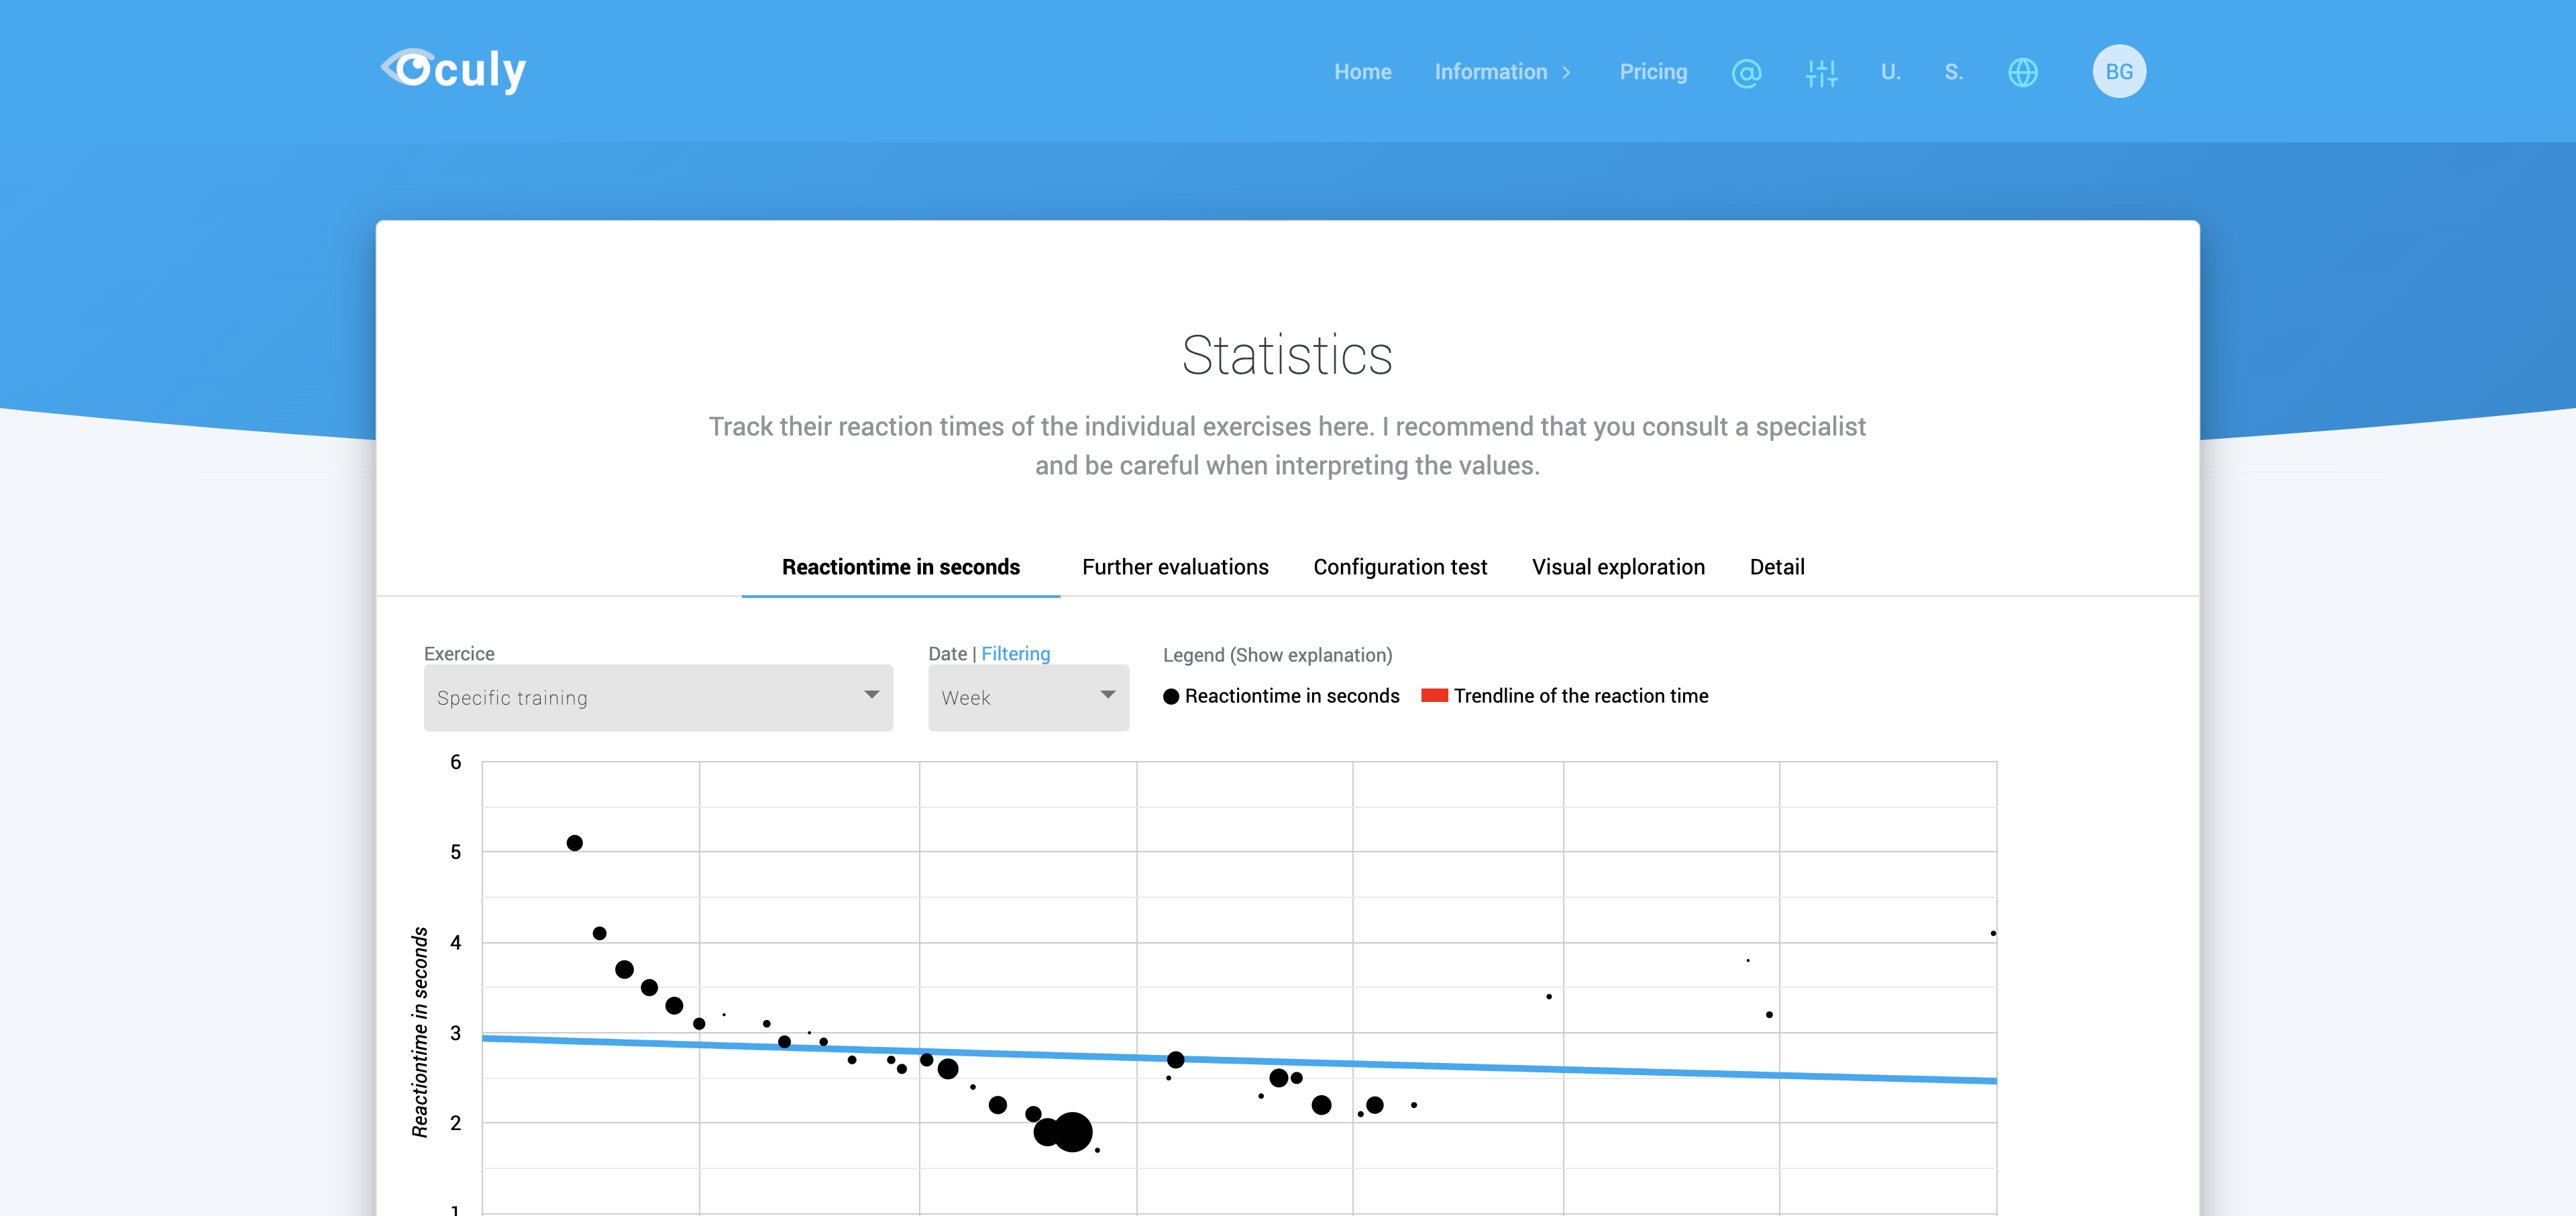
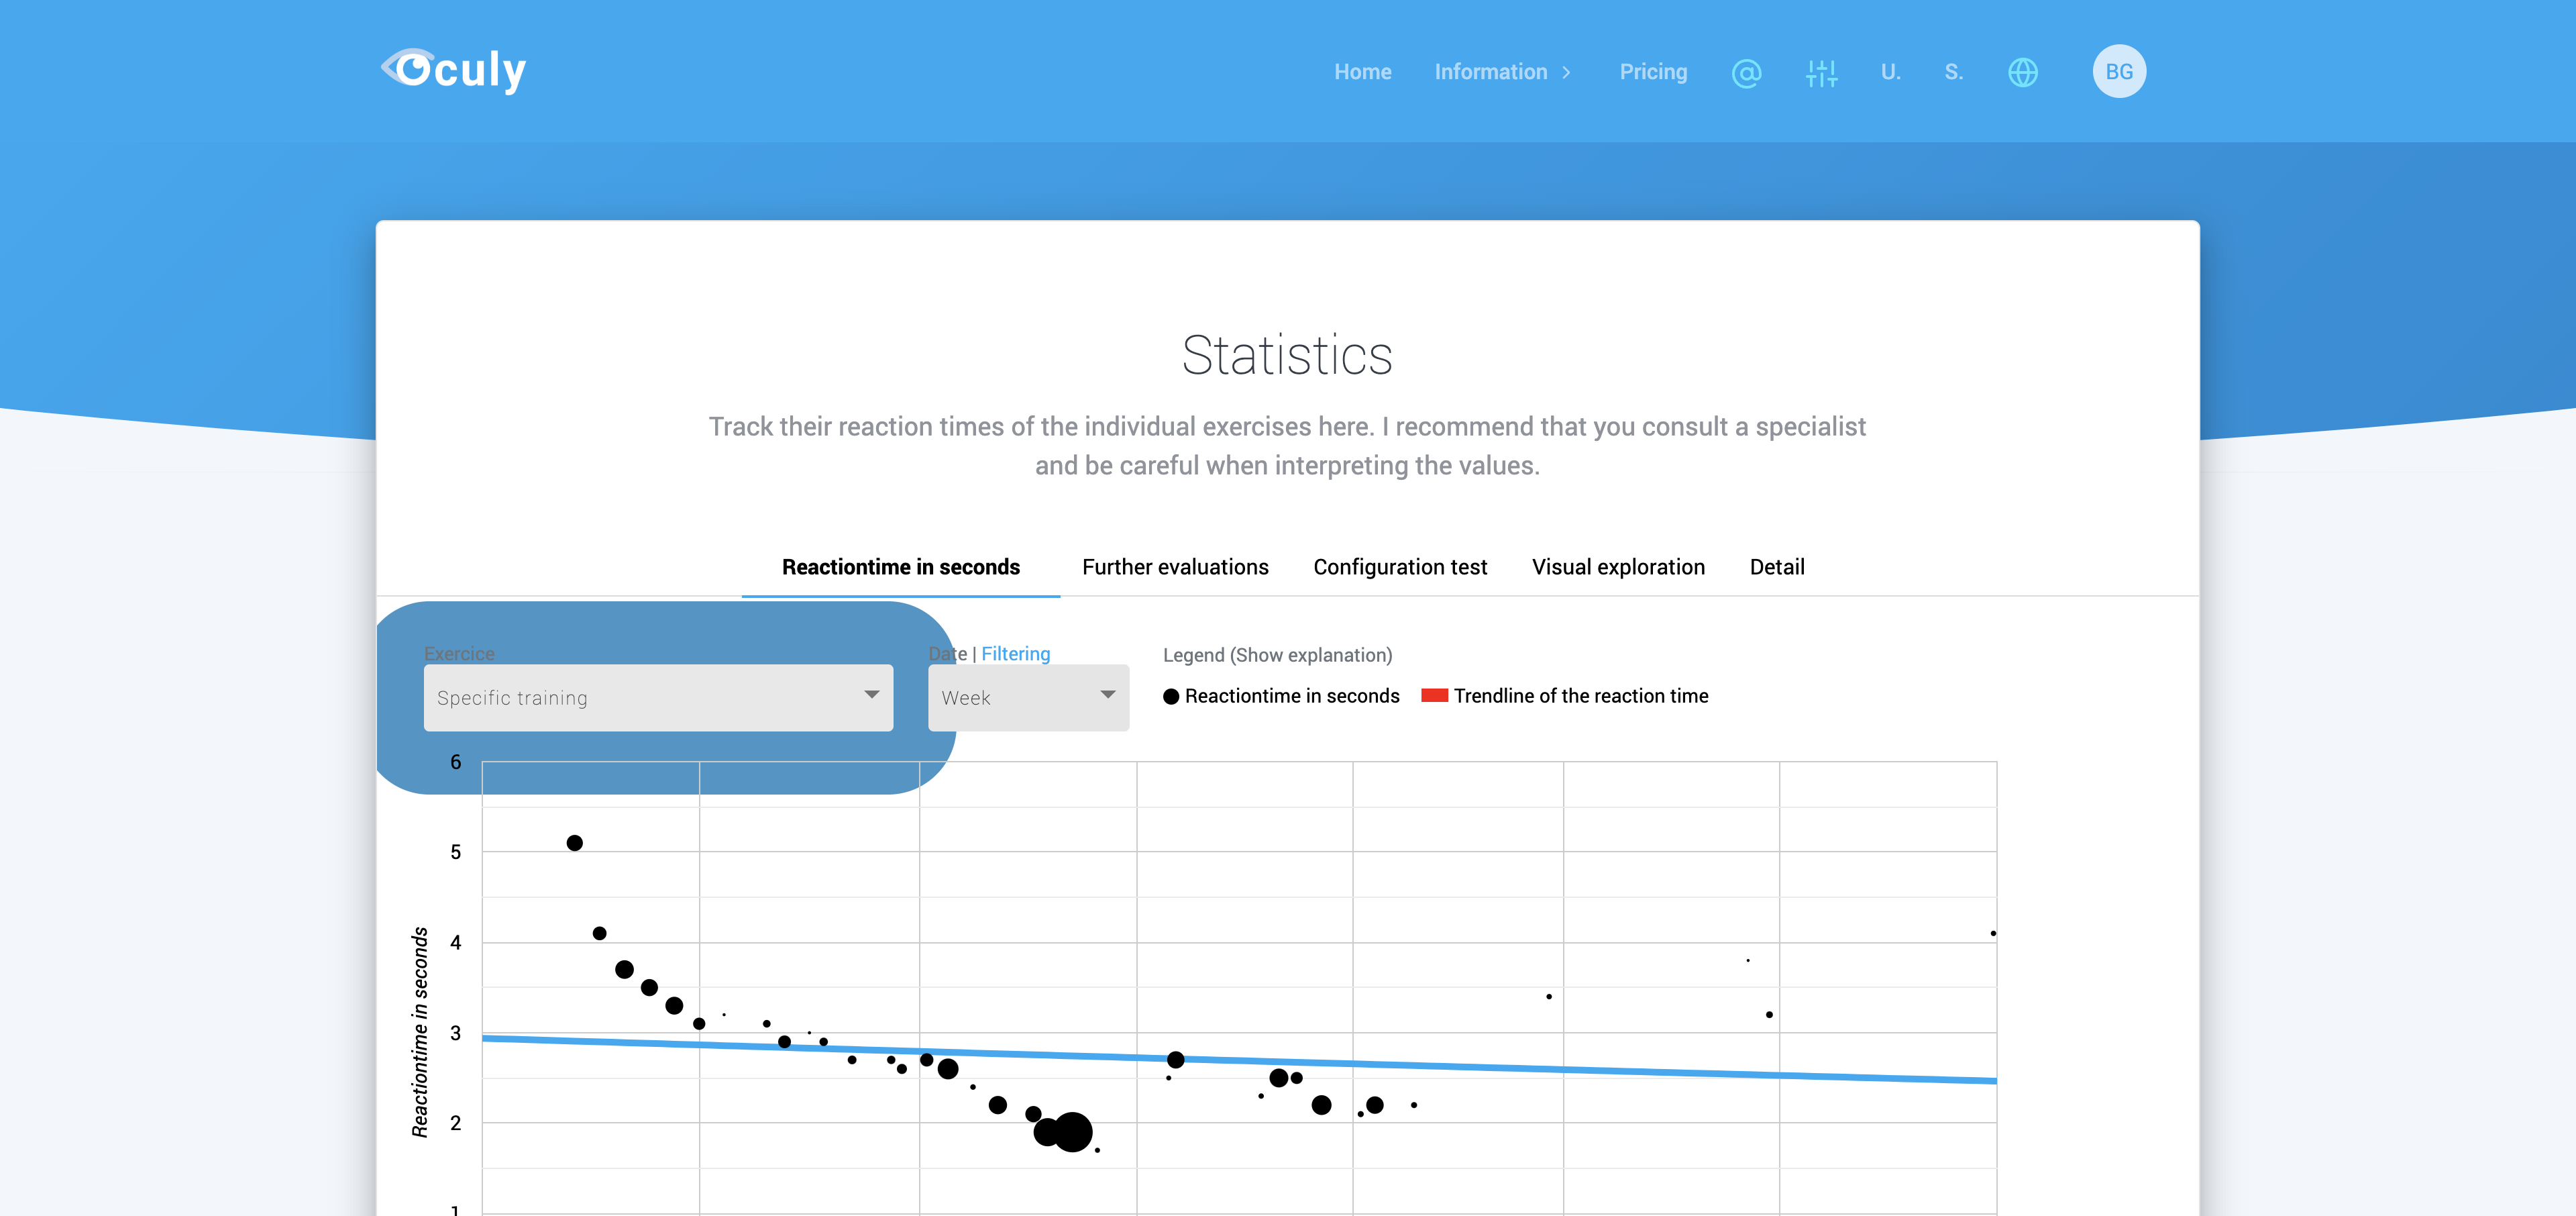
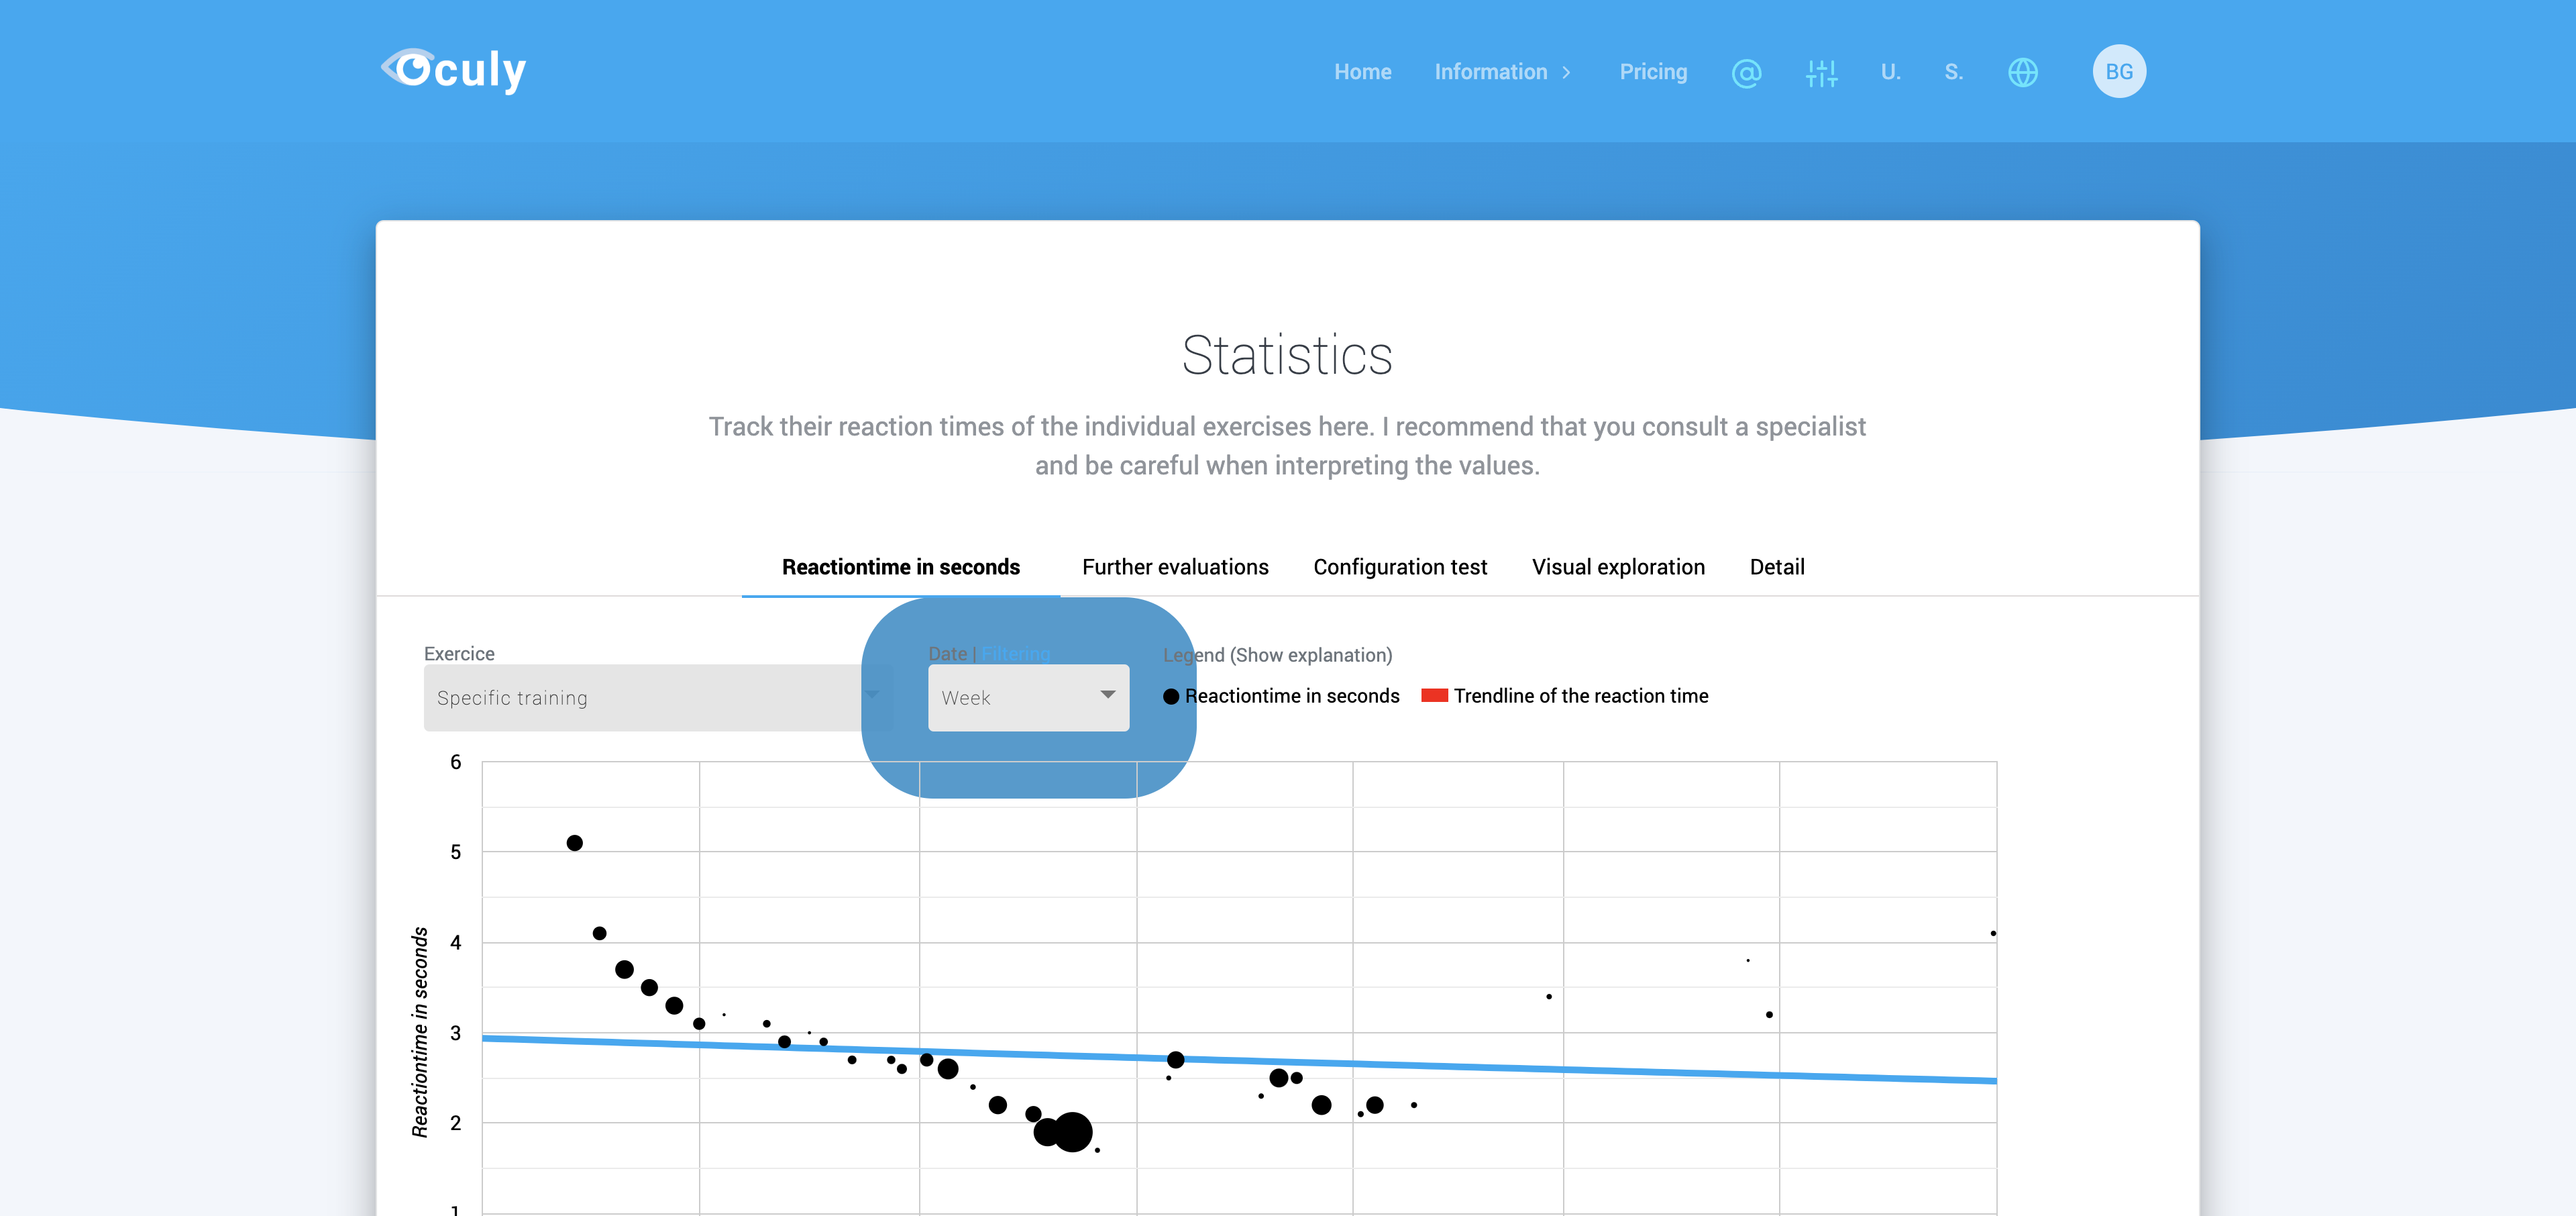
In this statistic you can see how your reaction time develops. The data is cumulated per week and is displayed per exercise. Some exercises offer additional filters.
The points show you how quickly you have found an object. The larger the blue dot the more objects you have found in this time
The red line corresponds to the trend line, which roughly shows how your reaction time develops
5. Select a specific date range
To display a specific date range, move the sliders to the left or right below the graphic

6. Analyze more details for a point
Hint: This feature is only available with the premium version!
To see exactly which workouts you did and when, you can click on a black dot to see more details.