Statistics: Other Evaluations
Here you can find out which possibilities you have to get even more exact evaluations about your performance.
Hint: These features are only available from the premium version!
To follow these instructions, you must be on the home page.
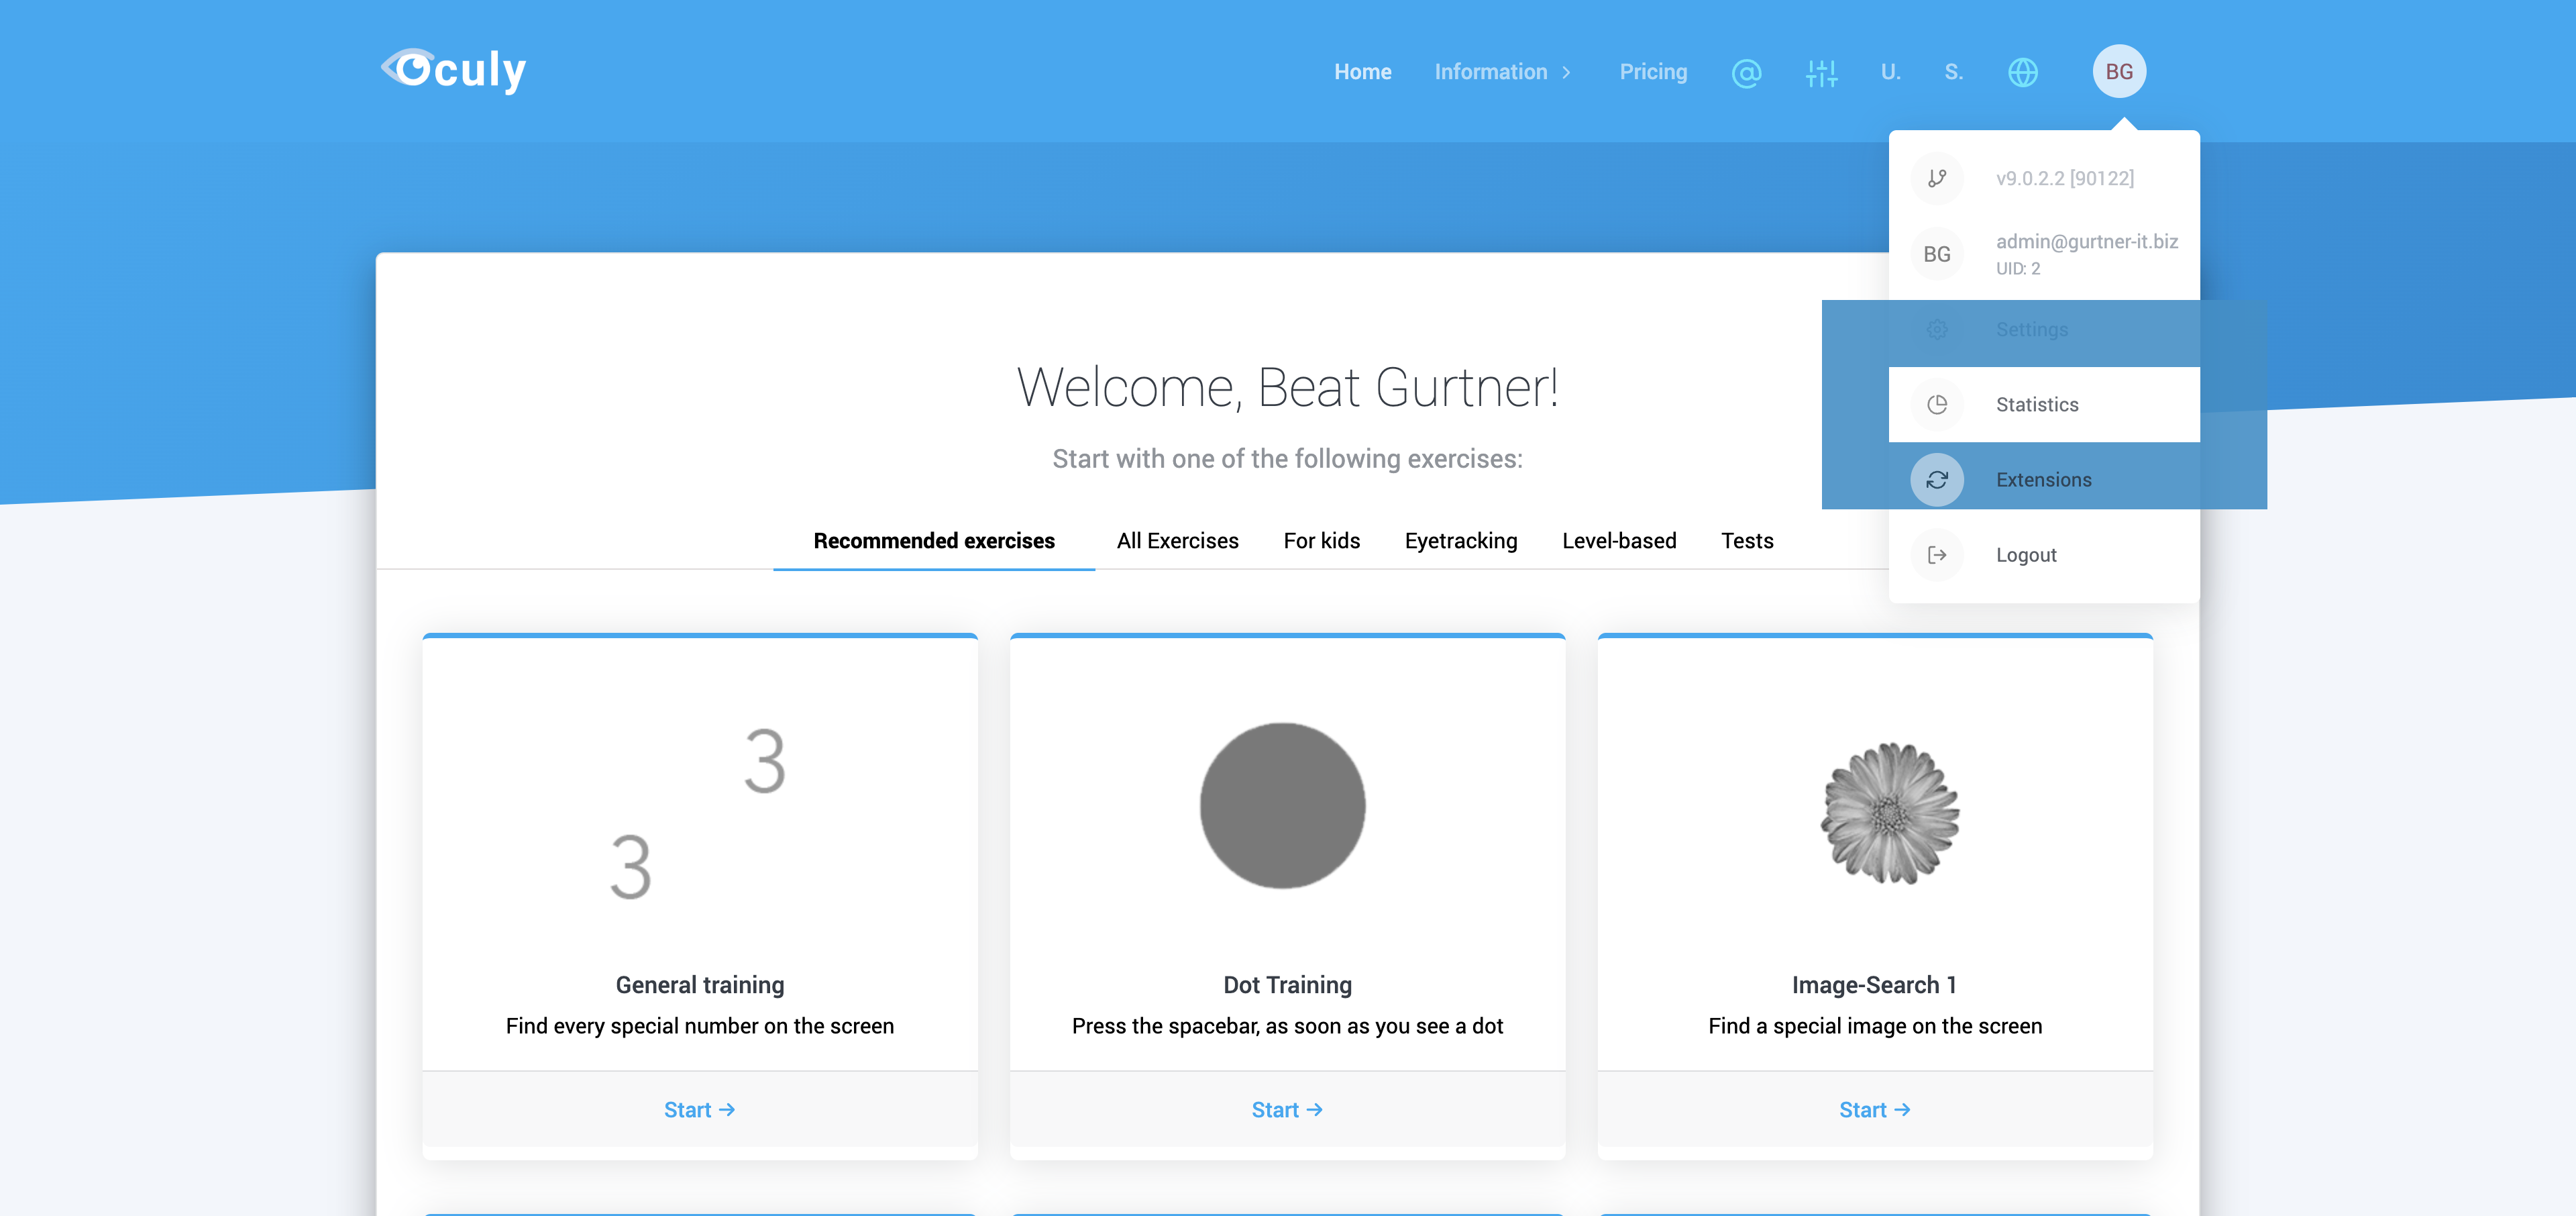
1. Click on ‘Statistics’ above
2. Click on ‘Further Analyses’ above
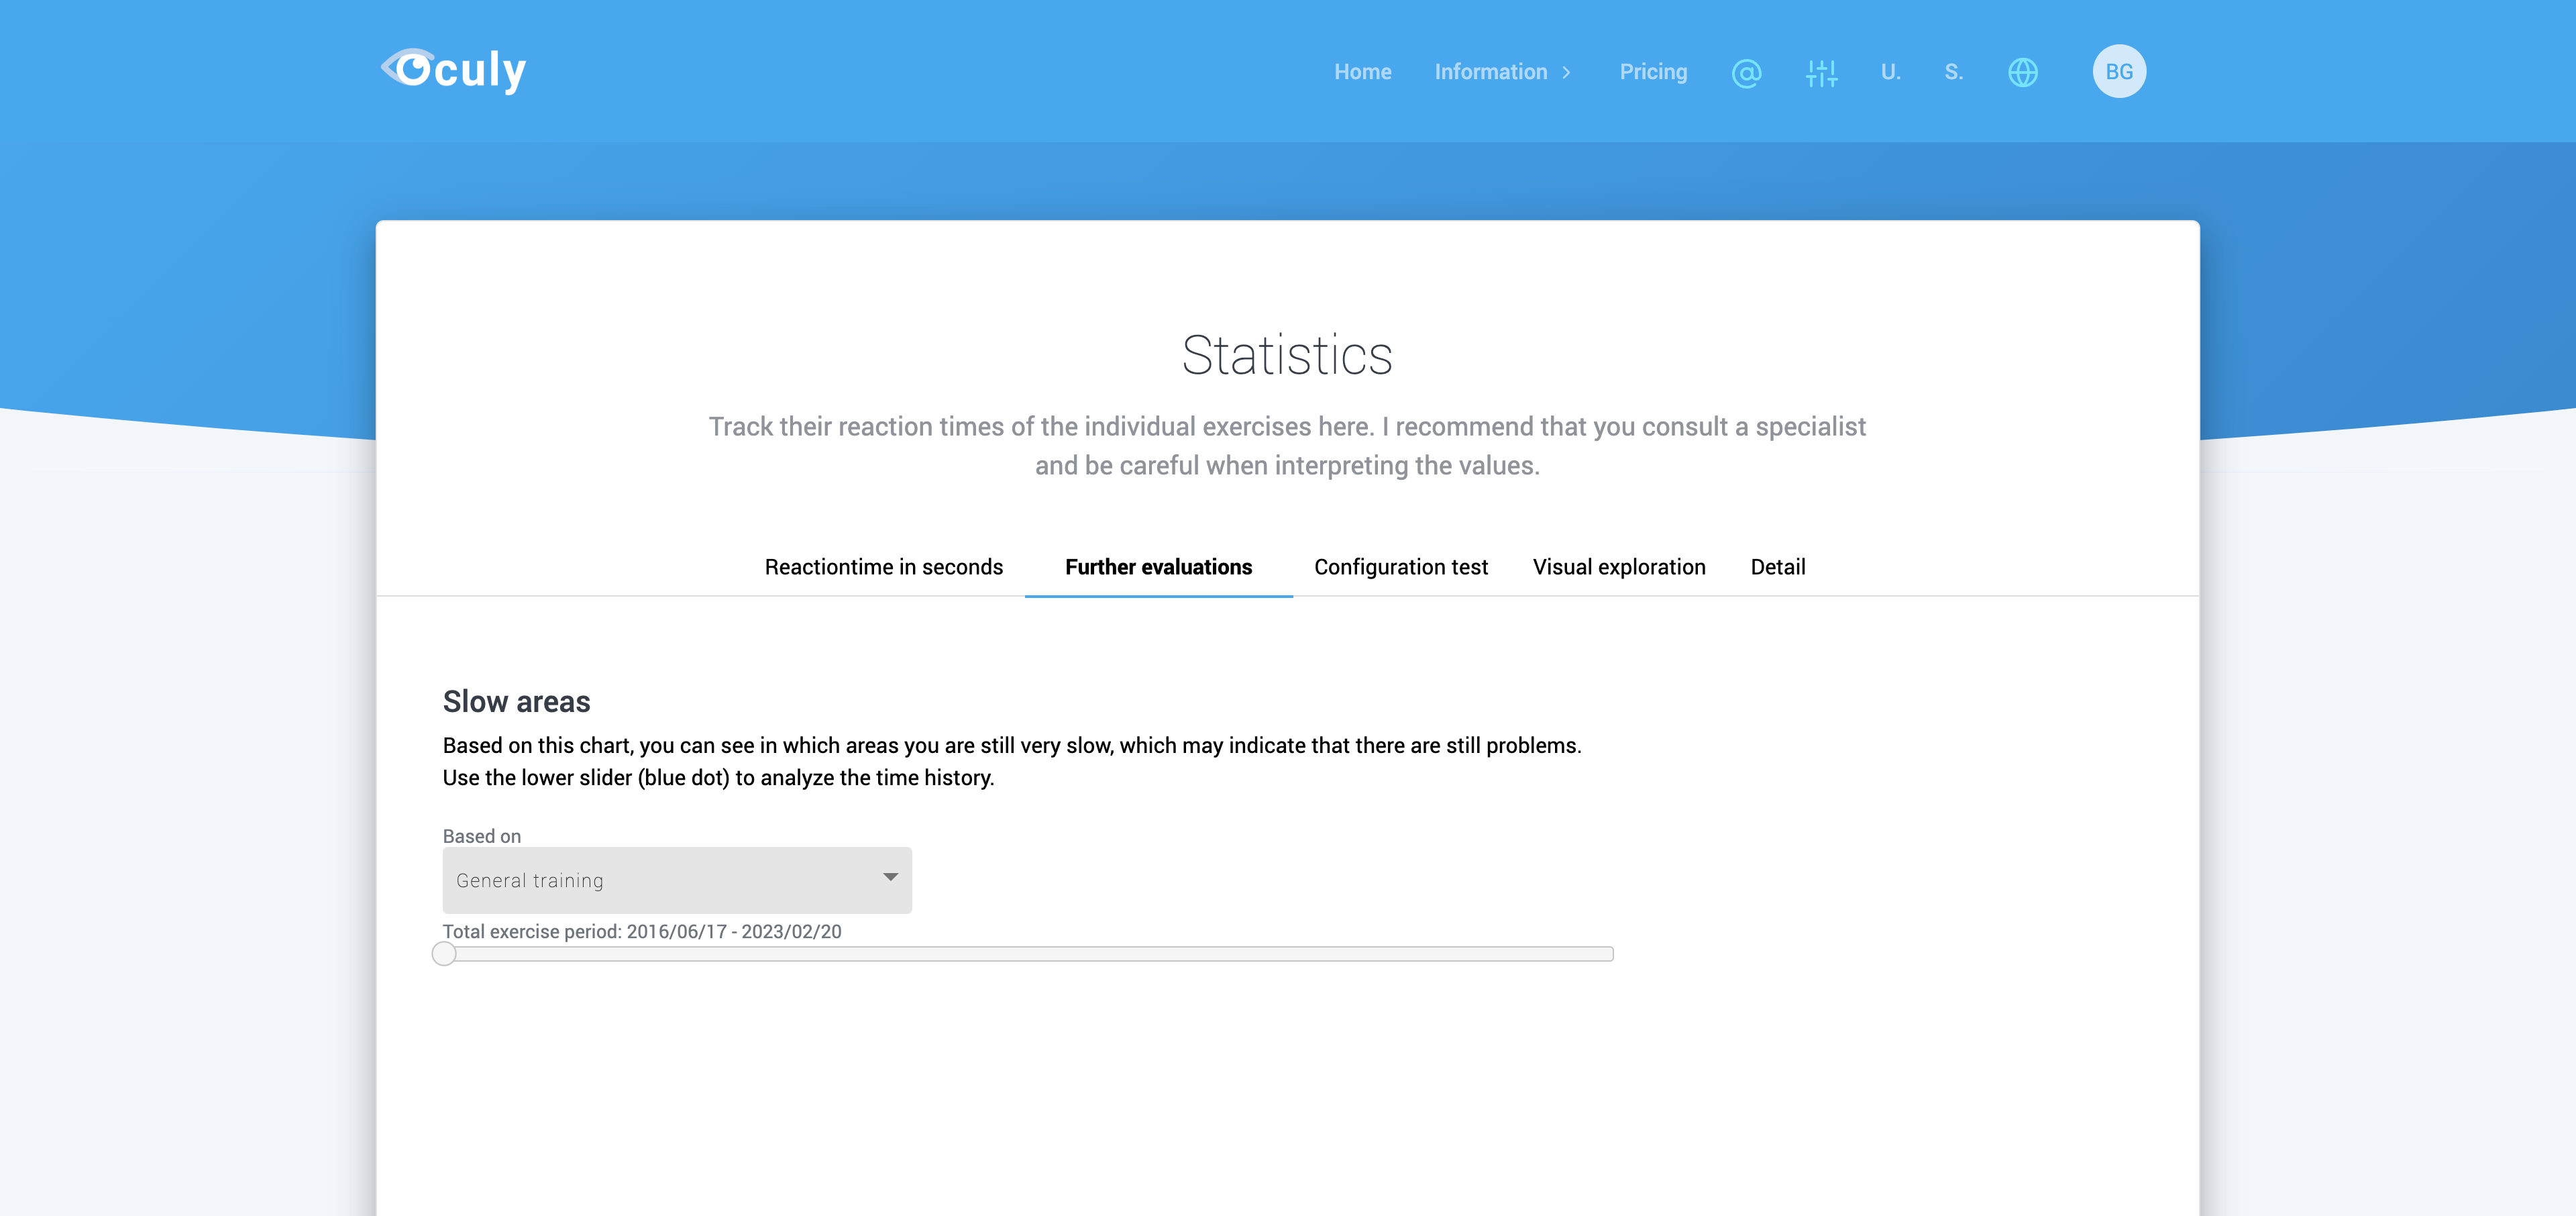
3. Slow areas
In dieser Statistik sehen Sie, in welchem Bereich Sie, welche Reaktionszeiten haben.
Important:
The data are collected from several exercises and evaluated. You may not yet see any data or not enough. Continue training and reopen the evaluation later.
You can also view the graph for a specific week so you can see changes. Click on the blue round button and move it to the desired date.

4. Image search 2
Based on the exercise Image Search 2 you can see here how fast the points found on which page. The values are expressed as a percentage and indicate when you have detected an object on average.
You can also view the graph for a specific week so you can see changes. Click on the blue round button and move it to the desired date. Or you can start an animation by clicking on’Start animation’.
